The last quarter of 2023 looked like this:
| Month | Avg Price | Avg size | AVG $$ per-Sq Ft |
| Dec-23 | $560,775 | 1,964 | $285.53 |
| Nov-23 | $570,913 | 1,982 | $288.05 |
| Oct-23 | $576,562 | 1,961 | $294.01 |
Here’s a graphical view of 2023:
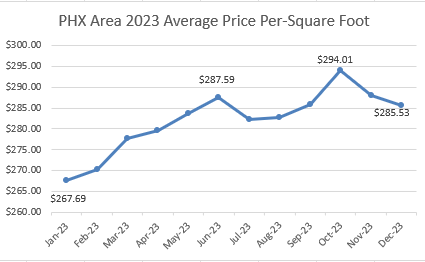
While the housing market is recovering, concerns remain about a looming recession, mortgage rates, escalating wars, and rising government debt that clouds the future. It is more likely the market will find an area of price stabilization rather than experience a crash or return to the previous era of double-digit value increases.
Note: It is important to recognize that property values are based on local neighborhoods, so please do not apply this overall average to your specific area/home. Call us at 602-300-0374 for a personal home valuation.
The Federal Reserve has been increasing rates to get inflation under control. To date there have been 11 rate increases. They stopped raising rates after the July 26th increase.
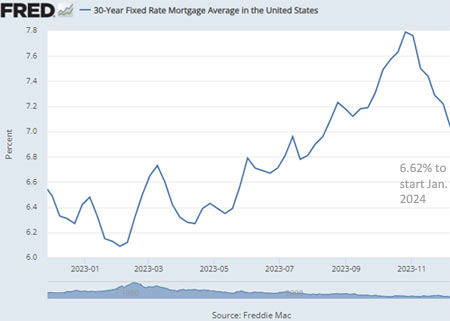
Mortgage interest rates in:
- 2021 averaged 2.96% within a range of 2.67-3.18%
- 2022 averaged 5.17% within a range of 3.11-6.95%
- 2023 averaged 6.81% within a range of 6.09-7.76%. The latter was the published rate to begin November (Source: St. Louis Federal Reserve).
The Federal Reserve has hiked rates 11 times:
- .25% in March 2022
- .50% in May (which was the largest since 2000)
- .75% on June 15th (the largest increase since 1994)
- .75% on July 27th
- .75% on September 21st
- .75% on November 2nd
- .50% on December 14th
- .25% on February 7th, 2023
- .25% on March 22nd, 2023
- .25% on May 3rd, 2023
- .25% on July 26, 2023
That’s 5.25% over 11 increases in about 20-months.
Here’s a month-by-month summary of 2023 (Source: St. Louis Federal Reserve). Interest rates in January 2024 started at 6.62%:
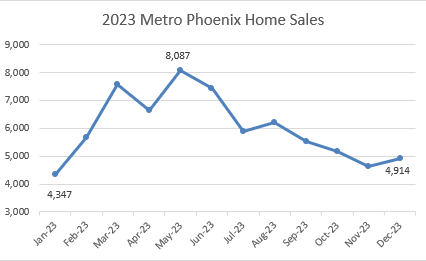
Here are bullet points that effectively tell the story of home sales in the Metro Phoenix area:
- 4,914 residential properties sold in December. That’s the lowest total for any December since 2007
- 4,632 residential properties sold in November. That’s the lowest total for any November since 2008
- 5,170 residential properties sold in October. That’s the lowest total for any October since 2008
- The 5,537 properties sold in September were the lowest total for any September since 2007
- August’s 6,213 were lower than any August since 2008
- July’s 5,930 sales were lower than any July since 2007
See a trend here? Thanks interest rate hikes! Notice the year-over-year decline in homes sales:
- 2023 – 72,436 sales
- 2022 – 85,832 sales
- 2021 – 110,486 sales
There has been an average of 1,800 less home sales per-month since interest hikes started pushing home buyers out of the market in April of 2022. Here is a graphical snapshot of 2023:
Click on “Historical Sales” above to see homes sales since 2007.
Listings are currently 2-3 times higher than when interest rates began rising. This is very good for buyers who have more choices. Below are representations of short and longer-term listings in Metro Phoenix:
- January 1, 2024 – 14,451
- December 1, 2023 – 15,981
- November 1, 2023 – 15,226
- October 1, 2023 – 13,281
- September 1, 2023 – 11,952
- August 1, 2023 – 11,108
Listings in all of 2023 averaged 13,601 per-month compared to 12,335 in 2022.
For a longer-term view, monthly listings averaged 5,900 properties in the 12-months before the 1st interest rate hike with a high of 7,649. They reached a peak of 20,340 in November 2020 before returning to an average of 13,661 over the last 6-months.
Below is a visual depiction.
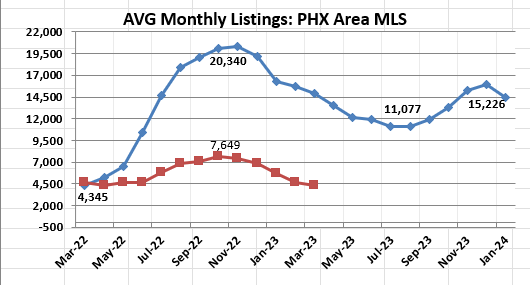
Note several things:
- It only took 2-months for the inventory to double from March to June 2022.
- Inventory more than quadrupled from March 2022 to November 2022
We track active housing inventory and compare it against a 3-year monthly average. Note how listings have been steadily declining in the Metro Area until this year:
- 3 year monthly average from 2021-2023 – 10,620 listings
- 3 year monthly average from 2020-2022 – 9,503 listings
- 3 year monthly average from 2019-2021 – 10, 762 listings
- 3 year monthly average from 2018-2020 – 14,409 listings
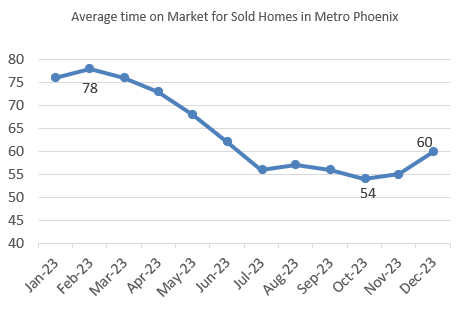
Time to sale/closing is another way to gauge activity in the housing market. The average time-to-sale in 2023 was 64 days compared to the 38 days in 2022. Note that this time was 30-days or less in the year leading up to the rate increases.
Homes priced less than $400,000 are going under contract much quicker — many with multiple offers because they’re now the most affordable price range.
Additionally, and as January 1st, 2024, the average home still waiting for an offer has been on the market for 66 days.
Monthly Phoenix Real Estate Market Update links:
 Count on us to provide factual and unbiased reporting with our Monthly Phoenix Real Estate Market Update. Call or text Kristina and I (Ron) at 602-300-0374 for any of your real estate needs. We have over 400 sales, 100 excellent reviews, a combined 35 years experience, and Kristina has 30+ years as an interior designer.